☀️ (Notice 1/2) ☀️ Happy New Year! We moved into a bigger warehouse last week. While we get settled, enjoy 20% off select products and free shipping (must be subscribed to our newsletter).

(Notice 2/2) - Answer our survey to get a 2000 yen off coupon on orders of 5000 yen or more (limited to first 500 respondents who are newsletter subscribers. Coupon expires at end of 2025).

🐍 2025年もよろしくお願いいたします!

Key statistics about Japanese tea agriculture

Key statistics about Japanese tea agriculture - Yunomi.life

Ian Chun |

Statistics from Japan's Ministry of Agriculture, Forestry, and Fisheries' report of the state of the tea agriculture industry.

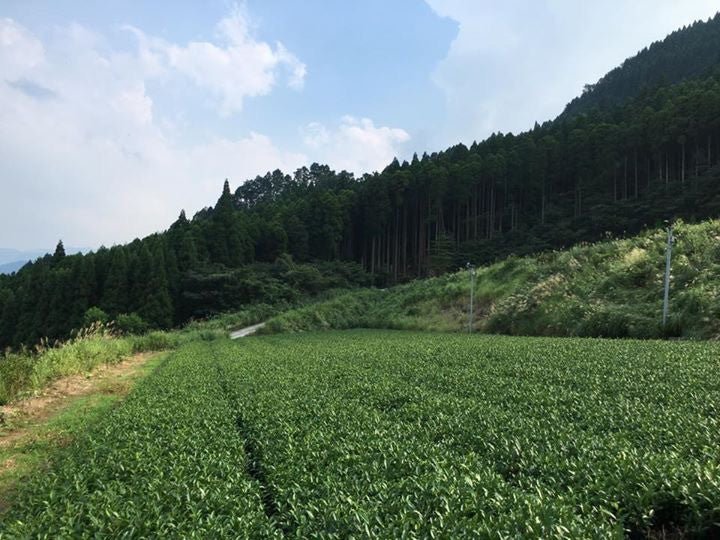
  • 44,000 hectares of tea fields across 20 prefectures. The top 3 prefectures make up 2/3 of this area: Shizuoka 17800 ha, Kagoshima 8610 ha, Mie 3040 ha. (2015 stats)
  • While this acreage is a 10% decrease from 2005, acreage per farm has increase nationwide as the number of farms has decreased from 37,617 in 2005 to 20,144 in 2015 (census data)
  • Production has decreased from 101k tons of tea in 2004 to under 80k in 2015.
  • From 2004 to 2014 the average price of tea produced in Japan per kg has declined 25% from about 2000 yen/kg to under 1500 yen/kg
  • Per household annual consumption has declined from 6432 yen for green tea (10866 yen for tea beverages overall) in 2001 to 4096 yen (10247 yen overall) in 2015. By amount, 1174 grams to 844 grams between 2001-2015
  • The exports of Japanese tea though has grown between 2001-2015 from 599 tons @ 1.152 billion yen to 4127 tons @ 10.106 billion yen.
  • The import of tea to Japan has decreased between 2001-2015 from 17,739 tons @ 5.695 billion yen to 3473 tons @ 2.339 billion yen

Need more stats, call us for a consultation!

コメントを残す

ご注意:コメントは公開前に承認されなければなりません